An Intro to Product-Led Growth from MarkovML
I recently gave a talk at super{summit} about how we are implementing product-led growth at MarkovML. MarkovML is Figma for ML teams - an easy-to-use collaborative interface for understanding data quality, evaluating models, and automating ML workflows.
In this blog post, we cover what product-led growth is, and a playbook for achieving it that you can implement at your company.
Let’s get started!
What is product-led growth?
Product-led growth is a model where instead of relying on salespeople, you build an intuitive product that markets and sells itself. People start using your product, find value in it, and then want to use it more and pay to access additional features.
For example, Google built Gmail as a free product that people loved. When they wanted to use it for business, Google was ready with their paid G Suite plans. Google didn't need salespeople to sell G Suite—they built a product that sold itself through the value it provided.
To implement product-led growth, here are the key steps:
1. Make sure your product is good enough that you don't need demos.
The key to product-led growth is having a product intuitive enough for users to adopt without much hand-holding. At MarkovML, we asked ourselves: is our product good enough that users don’t need a manual to get started? If the answer is yes, you have a solid foundation for building a product-led business model.
Our goal became optimizing the user experience to guide people through important and high-value actions, without them needing support. If we could achieve that, we knew we’d built something people would pay for.
2. Track what your users are doing.
Next, you need to have a quantitative understanding of how your users are currently using your free, self-serve product, so that you know which features to gate behind paid plans.
At MarkovML, to gain insight into how our users use our product, we implemented two analytics tools, Amplitude and Hotjar.
Using Amplitude
Amplitude is an analytics tool that lets you track events and user actions in your product like button clicks, page views, feature usage, etc. This can help you understand how users are actually interacting with different parts of your product, and which features users engage with the most, and which ones they rarely use.
For MarkovML, we tracked events like:
- Datasets on Navbar clicked
- Add dataset button clicked
- Dataset details page opened
- Different tabs of data set details page clicked
- Time spent on page
We also used Amplitude reports to analyze metrics like new users, dormant users, and active users.
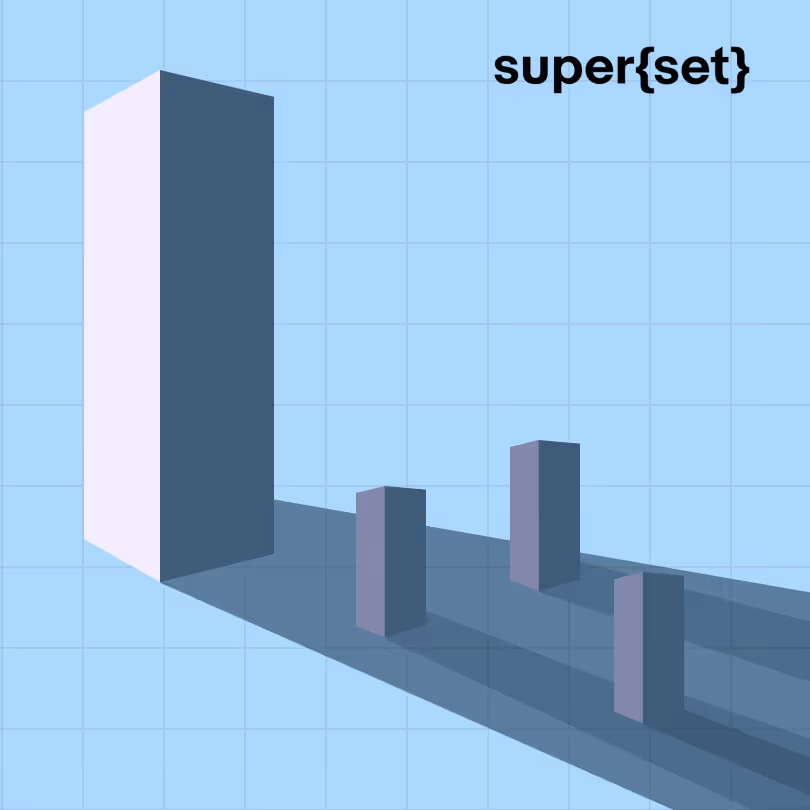
In the below reports, we could see users drop off in key flows like the data set registration process. This revealed that the process was too complex. We have now used these insights to simplify and optimize the data set registration flow for better conversion. New results are yet to come in! 🤞🙂

Using Hotjar
Hotjar is an analytics tool that records visitors' sessions, including mouse movements, clicks, taps, and scrolls. This generates heatmaps and recordings you can then analyze.
In our case, Hotjar heatmaps revealed unused screen real estate we could remove. For example, the heatmaps showed us that no one was clicking the buttons in our "Explore MarkovML" section. The live videos of user interactions also helped to highlight areas of friction or confusion that we could address.
To fix this, we rejigged the interface and now we have better results than before. More work is ongoing to further increase engagement on our dashboard page. This is how data and real insights should drive decision making.


3. Determine costs
Next, you need to understand the costs associated with your product so you can price subscription packages accordingly.
For example, at MarkovML, AWS Fargate and Lambda are two of our largest expenses. We used Metabase and Snowflake to analyze usage data and see how much compute, storage, and other resources customers were consuming. Specifically, we tracked the below metrics and mapped them to cloud costs:
- How much data people were uploading when registering data sets
- How many model experiments and evaluations people were running
- How many hours of notebook usage customers logged
4. Determine usage caps for your starter plan.

The insights from the usage and cost analyses should help shape your starter plan usage caps. The idea is to balance between hooking new users and encouraging them to upgrade.
For example, at MarkovML, we have seen that most people upload less than 1GB of datasets, so it makes sense to set a free dataset storage cap of 1GB. This enables the majority of users to be successful with their first experience with MarkovML. Note that this is what we want! If we are short-term greedy and set caps too low, and users are forced to pay before ever completing their first workflow with MarkovML, they are likely to just churn. The idea is to give users enough access to become engaged, then incentivize upgrading as needs grow.
5. Decide which premium features to build and how to price.
Apart from free usage caps, the data will also help you determine which additional features and resources to offer in paid subscription plans. For example, if users are running many model experiments, additional compute resources or custom model support may be appealing as a paid feature.
Note that premium features should extend and build on your core product capabilities. If you’re at a loss for what to build, start with the simplest, most important thing that users want and are willing to pay for. Just make sure the revenue potential of premium features justifies the development effort required.
The Ongoing PLG Process
In summary, product-led growth relies on building a product that markets and sells itself through the value it provides to customers. The keys to success are: build the right product, gain data-driven insights, optimize user experience, nail your starter plan, listen to customers, and never stop improving. Observing analytics on usage patterns, and monitoring costs will get you started, but the key is to think of it not as a one-time audit but as an ongoing process for optimizing user experience.
For more, watch the full video of my super{summit} presentation here, and find more videos at youtube.com/@supersetstudio
Tech, startups & the big picture
Subscribe for sharp takes on innovation, markets, and the forces shaping our future.
Let's keep in touch
We're heads down building & growing. Learn what's new and our latest updates.